Let’s Talk Markets
A complete analysis of the market to help you understand stocks better. Watch research videos and get other useful insights to be well versed with the latest market trends.
Understanding Stocks
Get acquainted with various Do’s & Don’ts of stock market trading. Read more and understand how you can cautiously use you money to make smart investments.
From the Service Desk
Are you uncertain about trading in a volatile market? Our service desk answers all your doubts regarding share trading and stock markets. Educate yourself on how the market behaves and be more confident with your decisions.
Technical Analysis
Learn how SMA (Simple Moving Averages), Bollinger Bands, Williams %R and various other technical charts can assist you in stock trading. Learn to make effective prediction on the movement of stocks using technical analysis of past-market data.
Management Musings
Learning from the experts - Know the macro views on the markets and the industry as our top leaders analyse and discuss the prevailing trends.
Insights
Get to the core of a company’s financial statements with insights provided by our experts. Read through the fine print of results and analysis to choose the right stock to invest.
Fundamental Analysis
Read all about our research team’s work on the “Fundamentals” of a company. Our analysts’ help you make informed decisions to help you make smart investments and generate better returns.
Others
Understanding Derivatives
uTalk
Share your experiences and opinions with us. Get to know the many fascinating stories of our employees, clients and everyone else who has an opinion.


If a scrip violates the support level and moves further downwards from these levels, it means that the selling pressure has far exceeded the buying pressure in the scrip. Hence, the price of the scrip would go down further and look for a new support level from which to change direction. Similarly, if the scrip has breached the resistance level, it means that the demand has far exceeded the supply or selling at that level and the price is likely to rise further in pursuit of a new resistance level. These violations, therefore, give good indications of the upward or downward movements of the prices of a scrip and a decision can be taken based on these movements. On the same lines, if double or triple formations are breached, it adds to the strength of the upward or downward movement of these levels. These violations are also called bottom violations or top penetrations and lead to the formation and discovery of new highs and lows for the scrip over a period of time.
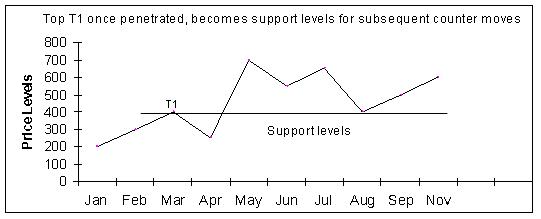
This is an important phenomenon and should be understood carefully. It means that once a support level of a scrip is violated, it could become a resistance level for all future upward movements. Similarly, if resistance level is penetrated, it could reverse roles and become a support level for future downward movements in prices. This scenario of resistance becoming support and support becoming resistance is termed as a reversal of role. It can be explained by way of the following figures

The strength of support and resistance levels depends on a combination of many factors. The first factor that needs to be taken into account is the time taken to reach the resistance or support level. So, for example, if the scrip has touched the resistance level very fast in a few trading sessions, a small resistance will be able to hold the prices down. If on the other hand, the scrip has fallen sharply over a period of time and then it meets the support level, chances are that the support will be strong enough to hold the price at that level.
0 comments Post Comment


