Let’s Talk Markets
A complete analysis of the market to help you understand stocks better. Watch research videos and get other useful insights to be well versed with the latest market trends.
Understanding Stocks
Get acquainted with various Do’s & Don’ts of stock market trading. Read more and understand how you can cautiously use you money to make smart investments.
From the Service Desk
Are you uncertain about trading in a volatile market? Our service desk answers all your doubts regarding share trading and stock markets. Educate yourself on how the market behaves and be more confident with your decisions.
Technical Analysis
Learn how SMA (Simple Moving Averages), Bollinger Bands, Williams %R and various other technical charts can assist you in stock trading. Learn to make effective prediction on the movement of stocks using technical analysis of past-market data.
Management Musings
Learning from the experts - Know the macro views on the markets and the industry as our top leaders analyse and discuss the prevailing trends.
Insights
Get to the core of a company’s financial statements with insights provided by our experts. Read through the fine print of results and analysis to choose the right stock to invest.
Fundamental Analysis
Read all about our research team’s work on the “Fundamentals” of a company. Our analysts’ help you make informed decisions to help you make smart investments and generate better returns.
Others
Understanding Derivatives
uTalk
Share your experiences and opinions with us. Get to know the many fascinating stories of our employees, clients and everyone else who has an opinion.


These formations are most common and are formed by plotting the upper and lower trendlines. The upper trendline is formed by joining the tops and the lower by connecting the bottoms. The incline of these trendlines indicate the type of triangle formation such as symmetrical, ascending, descending or broadening triangle. Each of these triangles are depicted by way of following figures.


Pennants are like symmetrical triangles where the upper trendline is declining and the lower trendline is rising. These formations are generally found over a period of three to four weeks and can be depicted by way of following diagrams:

Flag formations are like parallelograms - with two trendlines stooping upwards or downwards, indicating formation of a flag like image. This can be exhibited by way of the following diagrams:


Wedges are like triangles and have a significant incline indicating upward or downward movements. There are two variants of wedges. These may be rising wedges or declining wedges. These wedges may be depicted in the following manner:


Rectangles indicate a sideways movement of prices and are formed by connecting the almost identical tops and bottoms. A violation or penetration of the trendlines indicates a future trend of price movement. Bullish and bearish rectangles may be indicated as under:


0 comments Post Comment
- There should be an existing trend, which can be reversed and predicted through reversal patterns.
- The existing trendline should be violated or penetrated to indicate the change in trend and reversal of direction of price movements.
- The strength of a reversal pattern may be gauged by the height and width of the reversal pattern. The larger the height and width of the pattern, the stronger is the resultant reversal.
- Formation of patterns in tops and bottoms indicate the possibility of reverse movements. Thus, after completion of topping patterns, prices are expected to come down and after formation of bottoming patterns, prices are expected to rally.
- The volumes indicator may throw light on the strength of reversal patterns especially in case of reversal from bottoming patterns.
This is by far the most powerful reversal pattern and is depicted by a head and two shoulders (left and right). A neckline is drawn connecting the formations of bottoms, from which point prices move upwards to form the head and the right shoulder. The pattern is complete when this neckline is violated and prices are expected to fall further. The scrip price then tries to pull back by forming a new top, still lower than the neckline. It may be depicted by way of the following figure:

This is the mirror image of head and shoulder reversal pattern and may be depicted by way of the following figure. A penetration of the neckline formed by connecting the tops indicates that the price of the scrip may rally and may face a slight reversal, still above the neckline.

This reversal pattern is formed by more than one left and right shoulder. These patterns may again be 'complex' as well as 'complex inverse' patterns as depicted by way of the following two figures:


When head and shoulder reversal patterns, as depicted in earlier figures fail, it is termed as a 'failed head and shoulder' reversal pattern. The formation of this pattern clearly indicates the need for a stop loss order and covering short position, as the price tends to move up again. This can be depicted by way of following figure:

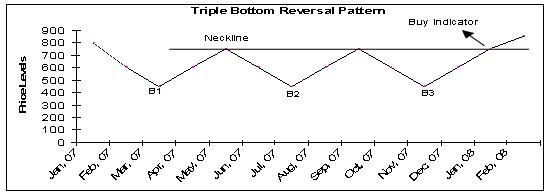
The formation of triple tops and the subsequent reversal of the price below the neckline formed by connecting the bottoms are depicted by a triple top reversal pattern. This is explained by way of the following figure:

This is just the mirror image of the triple top reversal pattern and can be depicted by way of the following figure. Penetration of the neckline indicates an upward movement of the price.
Also called the 'M type' reversal pattern, the Double Top Reversal Pattern price formation rises twice to form two tops with an intervening bottom. The formation of reversal is complete when prices fall below the previous bottom from where price had risen to form the second top. This is an indication that suggests selling. The formation may be depicted by way of the following figure:

The double bottom reversal pattern is a mirror image of the double top reversal pattern. The formation is complete when the price of the scrip penetrates the line drawn by connecting the top in between the two bottoms horizontally to the rising price trend. This may be depicted by way of the following figure:

Also known as a saucer type of reversal pattern, this indicates a steady but gradual shift in the trend from top to bottom followed by a rise back to the top (in case of rounding bottoms) and from bottom to top to bottom again (in case of rounding tops). A graphical representation will be as follows:

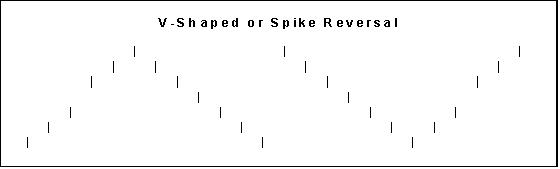
This reversal pattern is recognized by the V formation in the prices of a scrip and can be depicted by way of the following diagram:
A top or bottom broadening patterns may be formed to depict the price levels. In the case of a top broadening pattern, a horizontal line is drawn connecting the almost equal bottoms and rising tops. The formation is complete when the price dips below the horizontal line (in the case of a top pattern) and rallies above the horizontal line in the case of a bottom pattern. A graphical representation of these patterns is as below:


This may again be top horizontal pattern or bottom horizontal pattern and give indication of buy or sell depending upon whether price breaks out above or below the line connecting the tops or bottoms formations. These reversal patterns may be depicted graphically as per the following figures:


0 comments Post Comment

0 comments Post Comment
The Dow theory explains that there are three types of trends applicable in a market. These trends are known as primary trends, intermediate trends and short term trends. A primary trend is the broad upward or downward movement and lasts for over one year. It shows the market movement over the long term. An intermediate trend lasts for a period of two to three months. Short term trends last for a period ranging from two to three days to a maximum of a week or so. Thus, in a given market, these three trends are always in operation.
This is the long-term direction in the price movement and lasts for a year or a number of years. It also consists of three phases, wherein each phase is interrupted by an intermediate trend reversal lasting up to two to three weeks. This intermediate trend takes away 33-66 per cent of the earlier price movements, upward or downward. Thus, in the case of an upward movement, the intermediate trend will lead to an erosion of valuation to this extent and vice versa for a downward long-term trend. Each bull as well as bear market leads to the formation of three distinct peaks and bottoms, respectively. In the case of a rising market, factors such as confidence in business prospects, better corporate earnings and a bull frenzy come into play. In the case of a downward movement, factors such as loss of hope, a downfall in business performance and distress selling would come into play. The primary trends (both in case of a rising or falling market) can be explained by way of the following figures:


In case of an intermediate trend, the intermittent price movements would correct the earlier gains or losses made by the scrip. This trend lasts for a period ranging from two to three weeks to a maximum of two to three months and takes away 33-66 per cent of the gain or loss of the earlier period. Thus, in case of a rising trend, the secondary trend will lead to a fall by this extent and in the case of a bear market, it will lead to a gain to this extent. This can be explained by way of the following figure where the primary trend is rising and intermediate trend takes away a portion of the gains made by the scrip:

Short term trends are also known as minor trends and can be witnessed intra day or during a few days. These trends correct the over bought and over sold positions in the scrip caused by reversals made in the intermediate trends. For the purpose of analysis, it makes sense to ignore short-term trends and analyse the primary and secondary trends in prices.
0 comments Post Comment

In a rising trend, the scrip price will witness an upward trend. The price movement graph will show higher tops and higher bottoms over a period. This can be explained by way of the following figure:


In case of a falling trend, the zigzag movement of the price curve shows a downward trend with intermittent upward counter moves. Here the scrip witnesses new bottoms and tops that are lower than the earlier bottoms and tops seen by the scrip. The figure above reveals this pattern. Price T2 is lower than price T1 and price B2 is below price B1.
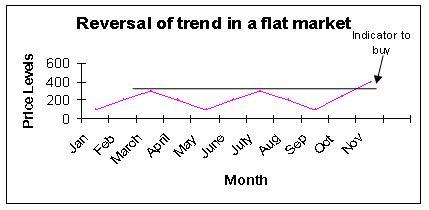
In case of a flat trend, the scrip witnesses sideway movements and no clear new tops or bottoms are formed over time. The new tops and bottoms formed are almost similar to the previous levels.

Trading strategies should invariably involve a consideration of the trend in the price of the scrip. Thus, if the trend is rising, it will pay if you are able to enter the market at an early stage of the trend. If the trend is falling, you will be rewarded if you exit the market at the peak or near the peak. In case of a flat trend, it is better to move away from the market, as the scrip is still searching for a direction and you may not reap much benefit trading in the scrip during a flat trend. Thus, it is better to study the trend seen by the scrip and act accordingly while making or exiting an investment.
As the saying goes "what goes up, must come down". So is the case of price levels of scrips - price movement in a scrip is never unidirectional. Thus, the price of a scrip may exhibit an upward trend but after a point, it may witness range-bound trading or even a fall in its price. So is the case with a scrip showing a falling trend. It may recover lost ground, make a smart recovery and handsome gains as time goes by. Thus, the trends in price movements of a scrip are susceptible to changes in direction. These changes in direction of movements of the prices of a scrip are termed as trend reversals.

0 comments Post Comment


Trendlines are a good indicator of directional changes in the price of scrips, if these lines are breached by technical charts. These breaches (which are also termed as a violation of the trendline), give clues about the possible buy or sale decisions an investor can take. Thus, whenever these trendlines intersect the actual price movement as depicted by way of a chart, a reversal of direction may be expected. Hence, it may require you to make an investment or exit an existing investment. This may be explained by way of following figures:


It is important to remember that all violations of trendlines do not necessarily mean reversal of trends. It is possible that in case of a rising trendline, if the trendline is violated, it will mean a temporary halt rather than an actual reversal of price movement. Similarly, in case of a falling trendline, it is possible that the violation may lead to a slower fall but the same direction of movement may continue rather than a reversal of movement. Whether a violation indicates a reversal or a temporary setback would depend upon a number of factor such as the volume position, the time period under consideration, the number of points touched, the steepness of the trendline, a reversal pattern formation and so on. It is good to carry out an analysis of the same for the purpose of gaining a positive indication of the potential price movements and direction thereof.
0 comments Post Comment


If a scrip violates the support level and moves further downwards from these levels, it means that the selling pressure has far exceeded the buying pressure in the scrip. Hence, the price of the scrip would go down further and look for a new support level from which to change direction. Similarly, if the scrip has breached the resistance level, it means that the demand has far exceeded the supply or selling at that level and the price is likely to rise further in pursuit of a new resistance level. These violations, therefore, give good indications of the upward or downward movements of the prices of a scrip and a decision can be taken based on these movements. On the same lines, if double or triple formations are breached, it adds to the strength of the upward or downward movement of these levels. These violations are also called bottom violations or top penetrations and lead to the formation and discovery of new highs and lows for the scrip over a period of time.
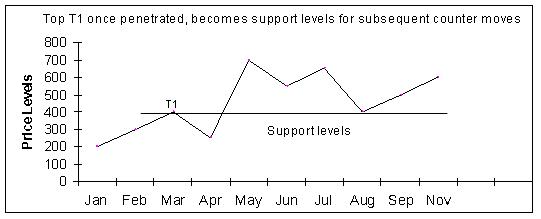
This is an important phenomenon and should be understood carefully. It means that once a support level of a scrip is violated, it could become a resistance level for all future upward movements. Similarly, if resistance level is penetrated, it could reverse roles and become a support level for future downward movements in prices. This scenario of resistance becoming support and support becoming resistance is termed as a reversal of role. It can be explained by way of the following figures

The strength of support and resistance levels depends on a combination of many factors. The first factor that needs to be taken into account is the time taken to reach the resistance or support level. So, for example, if the scrip has touched the resistance level very fast in a few trading sessions, a small resistance will be able to hold the prices down. If on the other hand, the scrip has fallen sharply over a period of time and then it meets the support level, chances are that the support will be strong enough to hold the price at that level.
0 comments Post Comment
0 comments Post Comment
0 comments Post Comment
There are basically two different methodologies for understanding the market and predicting its future trend. The first one is called fundamental analysis and the second is technical analysis. Fundamental analysis involves studying the financial position of a company, its potential performance in the future, the book value of its assets and other financial ratios. Thus, it analyses the share price with respect to the fundamentals of a company and predicts the future price movements based on the potential earning capacity. Fundamental analysis requires information about balance sheets, cash flow statements, growth patterns and future plans of the company. It also requires a study of the industry to which the company belongs and the economies in which it has its businesses. All these parameters are factored in while predicting the price movement of the scrip.
Labels: basicfundamental, stocks, technical
0 comments Post Comment


