Let’s Talk Markets
A complete analysis of the market to help you understand stocks better. Watch research videos and get other useful insights to be well versed with the latest market trends.
Understanding Stocks
Get acquainted with various Do’s & Don’ts of stock market trading. Read more and understand how you can cautiously use you money to make smart investments.
From the Service Desk
Are you uncertain about trading in a volatile market? Our service desk answers all your doubts regarding share trading and stock markets. Educate yourself on how the market behaves and be more confident with your decisions.
Technical Analysis
Learn how SMA (Simple Moving Averages), Bollinger Bands, Williams %R and various other technical charts can assist you in stock trading. Learn to make effective prediction on the movement of stocks using technical analysis of past-market data.
Management Musings
Learning from the experts - Know the macro views on the markets and the industry as our top leaders analyse and discuss the prevailing trends.
Insights
Get to the core of a company’s financial statements with insights provided by our experts. Read through the fine print of results and analysis to choose the right stock to invest.
Fundamental Analysis
Read all about our research team’s work on the “Fundamentals” of a company. Our analysts’ help you make informed decisions to help you make smart investments and generate better returns.
Others
Understanding Derivatives
uTalk
Share your experiences and opinions with us. Get to know the many fascinating stories of our employees, clients and everyone else who has an opinion.


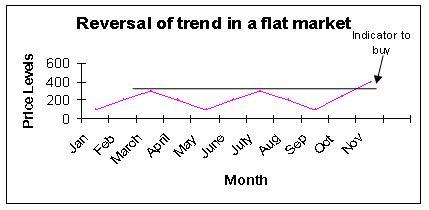
Trendlines are a good indicator of directional changes in the price of scrips, if these lines are breached by technical charts. These breaches (which are also termed as a violation of the trendline), give clues about the possible buy or sale decisions an investor can take. Thus, whenever these trendlines intersect the actual price movement as depicted by way of a chart, a reversal of direction may be expected. Hence, it may require you to make an investment or exit an existing investment. This may be explained by way of following figures:


It is important to remember that all violations of trendlines do not necessarily mean reversal of trends. It is possible that in case of a rising trendline, if the trendline is violated, it will mean a temporary halt rather than an actual reversal of price movement. Similarly, in case of a falling trendline, it is possible that the violation may lead to a slower fall but the same direction of movement may continue rather than a reversal of movement. Whether a violation indicates a reversal or a temporary setback would depend upon a number of factor such as the volume position, the time period under consideration, the number of points touched, the steepness of the trendline, a reversal pattern formation and so on. It is good to carry out an analysis of the same for the purpose of gaining a positive indication of the potential price movements and direction thereof.
0 comments Post Comment


